.svg)


 4
4You may have seen our previous blog post all about B2B infographics, which outlined what infographics are, why you should use them in your content marketing and how to go about creating one of your own, using free tools.
To give you some further inspiration and guidance on how your information, expertise and knowledge can become a beautifully represented visual, just look at the 10 B2B infographics we’ve chosen below to see how it should be done. Whether you want to create a “how to” infographic, which offers guidance to your industry, a “history of…” type visual to highlight your experience in the field, or are merely showcasing your latest research, these fabulous marketing infographics demonstrate how to achieve that successful mix of clarity, appeal, authority and shareability:
1) A much-shared, much-lauded infographic which encapsulates the Inbound Marketing Process in six steps. Its beauty lies in its simplicity, conveying the detail of what is a complex process in a concise and practical way, and using minimal design and easily-recognisable icons to illustrate. Here's a snippet - click on the image below to view all six steps.
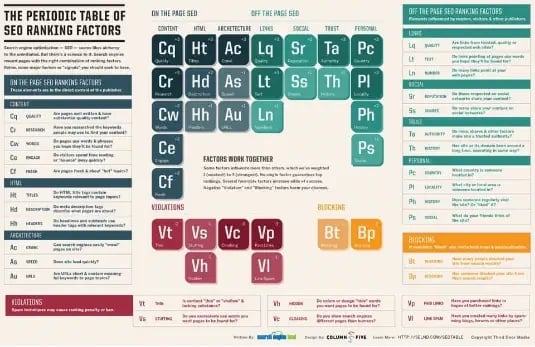
2) Remember the periodic table that you studied in Chemistry lessons? Here’s a cleverly adapted version from Searchengineland.com, outlining the chemical break-down of SEO. Visually appealing, the concept of copying something familiar to people from their youth, makes it stick in the mind.
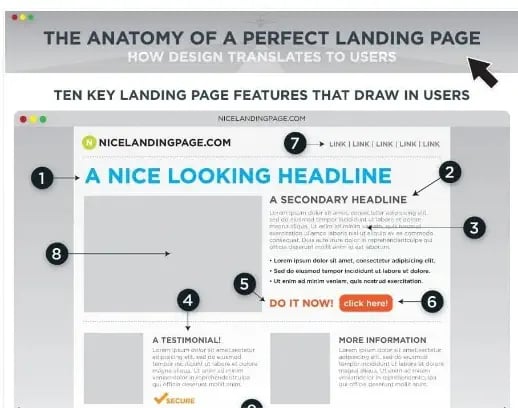
3) The Anatomy of a Perfect Landing Page is a great example of a helpful and comprehensive “how to” infographic. Shared widely amongst marketers, it describes with clarity and knowledge everything you need to consider when designing landing pages on your website for your inbound marketing campaigns. Click on the image to see the full infographic, a thing of wonder...
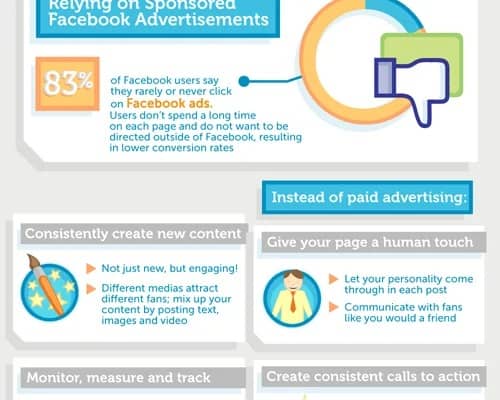
4) Another “anatomy of...” type infographic, this time charting the entire universe of B2B Social Marketing, and outlining the elements of a successful inbound marketing campaign using the medium. Using space-themed artwork, B2B Social Marketing Universe: The Vast Anatomy of a Successful Campaign offers a comprehensive, statistics-based overview of the most popular B2B social media platforms and lends advice on how marketers can best use them. Click on the image below to see the whole universe:
.jpg?width=476&name=b2b_social_marketing_universe_sn%20(1).jpg)
5) Equally useful to your audience might well be a “how NOT to…” infographic; underlining what to avoid in undertaking a particular task could prove invaluable to those doing it for the first time. This infographic from Prestige Marketing on common online marketing mistakes does this job very successfully.
6) Whether you are a new or existing blogger, this "what to do after writing you blog post" infographic from Divvy HQ offers a helpful, handy guide to maximising the reach and the amount of traffic to your latest posts. A perfect model of an infographic as a simple, useful learning resource.
7) If you’re creating a “history of...” type of infographic, this is an excellent example from Hubspot.com; it gives a wittily presented, exhaustive overview of marketing through the ages, from the heady days of Don Draper’s “Mad Men”, through the noisy years of interruption and direct marketing, right up to the birth of content-driven, permission-based Inbound Marketing
8) This infographic from Unbounce.com fits the “how to” genre …and then some! It demands the attention of its audience by issuing a manifesto – stylised from the cold war era - which lists 10 edicts for marketers pursuing lead generation. Thoroughly compelling, thanks to its visuals, its content and its authority.
9) This Content Marketing Matrix infographic is true to its roots, in that it is data visualisation in its purest form, which also manifests as a useful tool for its audience. In this case, the clever people at smartinsights.com have mapped the numerous guises of online content onto a matrix whose axes consider where your customer might be along their journey with your company, alongside what their response to your business’ content might be. Simple, practical and knowledgeable – it provides viewers a mechanism for evaluation and strategy.
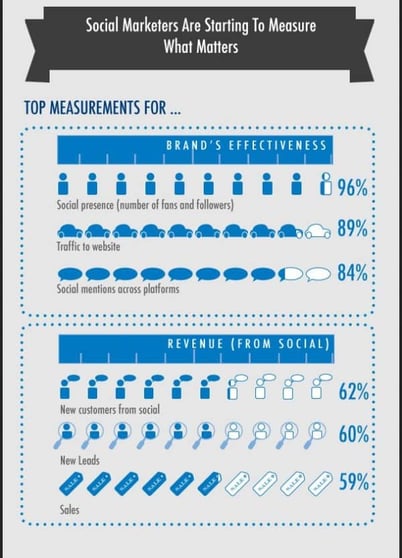
10) Another example of an infographic as a visual presentation of recent research, based on the latest “State of Social Media Marketing” survey by Awareness Inc. Using icons, pictograms and charts, it demonstrates how infographics can illustrate research findings, and present statistics and data in an appealing and memorable way.
So that's our list of 10 B2B infographics that rock, to inspire and delight you. But with the hundreds of infographics out there, which B2B marketing visuals are your favourites? And have they inspired you to get creative? With much thanks and full credit to all the infographic designers above.

