


 7
7Editors note: This blog post was originally published in January 2016 and has since been updated for optimal relevance and accuracy.
Digital marketing can produce lots of data – but what does the data really mean?
Is it really helpful?
This post will give you five questions to ask about your marketing data to ensure it’s of value to you.
But first, what are the most important questions you need answering?
Are you asking the right questions?
Let’s face it, the two questions that you really want to know the answers to are:
- How effective is your marketing?
- How could you do it better?
If we look at the first of these questions, you have to start with a definition of effective. Let’s assume that this is relatively simple – does your inbound marketing increase your organisation’s revenue?
Now measuring revenue is something you’ll already be doing, but how do you connect that to your marketing activities? The obvious choices would be to measure the number of inquiries or leads, the number of conversions and the number of orders placed. This can be relatively simple if you are only doing digital marketing - where data is easy to come by, but if you are doing traditional marketing and conventional sales, it is harder to attribute an increase in revenue to your marketing efforts.
1. Who is being measured?
Be careful that your data is looking at your target market. You might be a car manufacturer who is really pleased that your web traffic has increased by fifty percent; however, if that traffic is from schoolchildren too young to buy a car, that’s not going to help your bottom line.
Likewise, on social media, you can have many followers, but if they aren’t related to your target market, you are wasting your time. T
his is related to the issue of representativeness – how representative is your sample? If using an inbound methodology, then refer to your buyer persona(s) – when collecting data on your social media followers, website visitors and blog post readers – it should be as representative as possible of your buyer personas.
2. What is it measuring?
There is a real danger of collecting data for the sake of it – measuring things just because they are easy to measure, not because they are useful.
Many web statistics that are easily available – number of website visits, time spent on page, followers on social media and post likes – measure popularity, not effectiveness. Effectiveness is understanding and action. Measuring whether someone understands and retains a message is very difficult.
Fortunately, measuring whether someone acts on the marketing message should be easy – with the right marketing platform and/or analytics. With landing pages and content offers encouraging potential clients to exchange their contact details via a form – your analytics will tell you who, what and when.
Now don’t get me wrong, measuring popularity is useful – it can show you the general direction you are going in, but measuring specific actions taken is more useful, and more concrete. And this is exactly the data you need to be able to nurture leads and serve up smart content – content that varies according to the stage of the buying process the buyer is in.
3. Is it timely?
Six months is a lifetime on the Internet. With technology, product cycles, trends and fashions all changing rapidly – and with the speed of change itself ever-increasing, it is all too easy to make decisions based on old data.
Data that may have been superseded by events or even made redundant by changing circumstances. So if looking at third party data or information from the Internet, for example for a blog post or an eBook you are researching, always check to see when the data was collected – try and work out a use-before date. And always strive to get the most up-to-date figures available.
Ultimately, you should aim to collect your own marketing data in real time. For example, HubSpot’s Inbound software will show you when someone has viewed a page, clicked a link, submitted a form and downloaded an eBook, as it happens. Remember, this information will still have to be analysed before subsequent actions are taken. Here, intelligent software systems that take the data and extract meaningful insights from it in real-time are the way to go.
4. How big is the sample?
How many times do you see headlines in the newspapers about the latest health scare based on new research? Next time you see one,So when looking at marketing data, always look at the sample size, small data sets are prone to bias. The smaller the sample, the greater the risk that it’s results will be incorrect. So beware of ‘Small Data’. A typical area where this could be an issue is A/B testing of email newsletters – unless you have a large number of subscribers, then splitting them to try different copy or designs is going to be inconclusive or misleading.
5. Are they any external factors introducing bias?
Have you used common sense? Look at the data sets carefully, look at the time they were collected, the date, the area they cover.If your company was mentioned in a newspaper article and subsequently there was a huge increase in visits to your page, you might conclude that it was your blog post that drew in the visitors or a very effective post on social media. But by looking a bit closer at the data, you might be able to see that neither was the cause of the extra traffic.
Is all this data helping you make decisions?
The concept of big data is a simple one – it’s about using as much data as you can, the idea being that the more data you have the better – that’s got to be true right? Unfortunately, data alone is never enough, it doesn’t matter how many times you measure something, or how accurately, or in how many ways, the data will only tell you what is happening, it will never tell you why.And big data just means more data – and more data causes its own problems: requiring more time to be spent cleaning and analysing. After all, producing actionable insights depends on how well and how fast you can make sense of the data – not how much data you can collect. Bear in mind that all data can suffer from common statistical errors – big data just has them on a bigger scale.
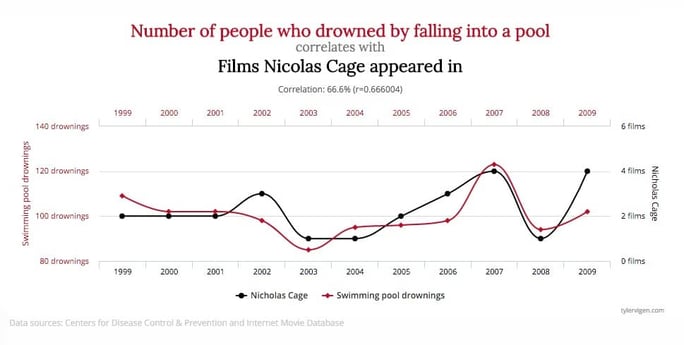
One last point – don’t mistake correlation with causation. This is a statistician’s mantra. Just because something happens at the same time or the same rate as something else does not mean it causes it, or even that there is a connection. An example would be: As ice cream sales increase, the rate of drowning deaths increases sharply. Therefore, ice cream consumption causes drowning. This, of course, is not true, there is a third factor at work – ice cream sales increase during the summer when more people will go swimming – there is no direct connection between the two sets of data. Another example is that the faster that windmills rotate – the more wind there is. Therefore, windmills create the wind. In this case, the relationship is around the wrong way, we know it’s an increase in the wind that causes the windmill to turn faster.
In marketing terms, you might look at the popularity of your blog posts and assume that some blog topics are clearly more interesting to your audience when the actual truth is that the images are more attractive on those blogs.
Data of all sorts is essential to the modern marketer – to gauge progress, to measure success and to evaluate different approaches. However, unquestioned data can be a very dangerous thing, leading to incorrect assumptions and disastrous decisions. Make sure you know where your data comes from and what it is actually measuring.
Given the right data with intelligent, proper analysis, you can answer the first of your need to know questions, “How effective is your marketing” and develop constructive ideas to answer the second, “How could you do it better?”.

